
1991
On & Off the Field

Award Winners & Selections



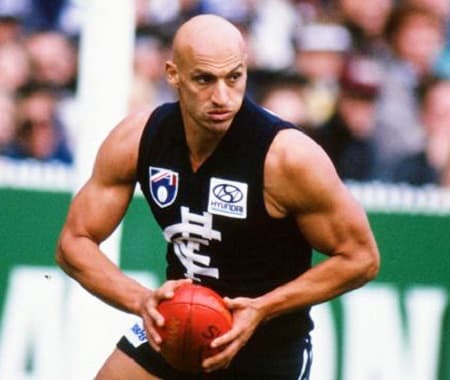


Season Review
In 1991 the competition expanded to 15 teams with the admission of the Adelaide Crows, after previously having expanded to 14 teams in 1987. The finals system would now be based on a top 6 system, having previously been based on a top 5 introduced in 1972. The expansion would also require the competition to be expanded from 22 rounds to 24, but each team would have 2 byes and therefore play only 22 home and away games each, the traditional number. This system would survive until the Top 8 was introduced in 1994 and the Fremantle Dockers were introduced in 1995. This gave the AFL an even number of teams and removed the need for the byes, allowing a 22 round competition once more.
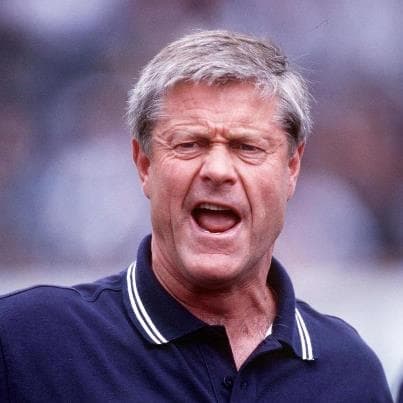
David Parkin was re-appointed coach of the Blues for a second stint, after previously having coached the club to two flags between 1981 and 1985.
For the first 15 rounds of the season, the Blues were competitive while not particularly consistent. The team would win two games in a row twice during this period and also lose two games in a row twice. In the other matches the club alternated between winning and losing. While not being able to string consecutive wins together consistently, the competitiveness of the side produced an 8 win, 7 loss record and eighth place on the ladder, only one win out of the top six.
Unfortunately, the next three rounds (16-18) resulted in three close losses (by 7, 7 and 12 points respectively) which effectively ended any chance of finals action. The team actually fell away toward the end of the season, winning only one of its last nine games. The Blues would finish with an 8 win, 14 loss record in eleventh place.
In an indication of the rebuilding process that David Parkin had begun, 18 senior players finished their careers at the end of this season, laying the foundation for the team's improved form in 1992.
Ladder
Pos | Team | Wins | Draws | Losses | Points | For | Against | % |
1 | West Coast | 19 | 0 | 3 | 76 | 358.337.2485 | 219.218.1532 | 162.2 |
2 | Hawthorn | 16 | 0 | 6 | 64 | 407.351.2793 | 300.255.2055 | 135.9 |
3 | Geelong | 16 | 0 | 6 | 64 | 382.368.2660 | 289.287.2021 | 131.6 |
4 | St Kilda | 14 | 1 | 7 | 58 | 371.286.2512 | 299.293.2087 | 120.4 |
5 | Melbourne | 13 | 0 | 9 | 52 | 343.297.2355 | 309.269.2123 | 110.9 |
6 | Essendon | 13 | 0 | 9 | 52 | 318.295.2203 | 285.307.2017 | 109.2 |
7 | Collingwood | 12 | 1 | 9 | 50 | 339.315.2349 | 295.263.2033 | 115.5 |
8 | Nth Melbourne | 12 | 0 | 10 | 48 | 355.326.2456 | 399.299.2693 | 91.2 |
9 | Adelaide | 10 | 0 | 12 | 40 | 297.259.2041 | 330.302.2282 | 89.4 |
10 | Footscray | 9 | 1 | 12 | 38 | 258.267.1815 | 297.282.2064 | 87.9 |
11 | Carlton | 8 | 0 | 14 | 32 | 269.264.1878 | 302.301.2113 | 88.9 |
12 | Sydney | 7 | 1 | 14 | 30 | 340.320.2360 | 403.360.2778 | 85 |
13 | Richmond | 7 | 0 | 15 | 28 | 308.293.2141 | 354.326.2450 | 87.4 |
14 | Fitzroy | 4 | 0 | 18 | 16 | 261.271.1837 | 399.377.2771 | 66.3 |
15 | Brisbane Bears | 3 | 0 | 19 | 12 | 287.254.1976 | 413.364.2842 | 69.5 |
People of 1991
Coach: David Parkin
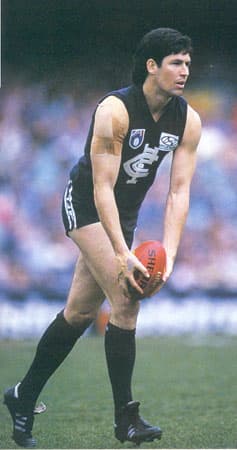
Captain: Stephen Kernahan
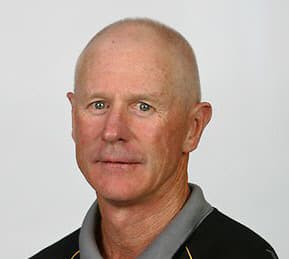
Best & Fairest: Justin Madden
Leading Goal-kicker: Stephen Kernahan - 46 goals
Leading Brownlow Vote-getter: Peter Dean - 11 votes
Debuts
Round 24: Ang Christou
Round 12: Darren Tarczon
Round 9: Michael James
Round 5: Mark Arceri
Round 2: Andrew Cavedon
Milestones
100 Games: Stephen Silvagni, David Rhys-Jones, Adrian Gleeson
Retirement: David Glascott (173 games)
State Representatives: Andrew Phillips, Adrian Gleeson, Justin Madden, Mil Hanna, Peter Dean, Tom Alvin
|
By Opponent
14 clubs faced
| Opponent | P | W | D | L | For | Agn | Win % |
|---|---|---|---|---|---|---|---|
| Adelaide | 2 | 1 | 0 | 1 | 21.26 (152) | 19.22 (136) | 50% |
| Brisbane Bears | 2 | 1 | 0 | 1 | 30.40 (220) | 23.32 (170) | 50% |
| Essendon | 2 | 0 | 0 | 2 | 25.28 (178) | 30.23 (203) | 0% |
| Geelong | 2 | 1 | 0 | 1 | 24.19 (163) | 27.36 (198) | 50% |
| Hawthorn | 2 | 0 | 0 | 2 | 19.22 (136) | 41.32 (278) | 0% |
| Melbourne | 2 | 0 | 0 | 2 | 27.16 (178) | 34.31 (235) | 0% |
| Richmond | 2 | 1 | 0 | 1 | 31.30 (216) | 32.27 (219) | 50% |
| St Kilda | 2 | 1 | 0 | 1 | 28.27 (195) | 30.35 (215) | 50% |
| Collingwood | 1 | 1 | 0 | 0 | 12.10 (82) | 10.2 (62) | 100% |
| Fitzroy | 1 | 1 | 0 | 0 | 8.12 (60) | 6.5 (41) | 100% |
| Footscray | 1 | 0 | 0 | 1 | 1.10 (16) | 8.9 (57) | 0% |
| North Melbourne | 1 | 0 | 0 | 1 | 14.5 (89) | 13.17 (95) | 0% |
| Sydney | 1 | 0 | 0 | 1 | 17.8 (110) | 18.16 (124) | 0% |
| West Coast | 1 | 1 | 0 | 0 | 12.11 (83) | 11.14 (80) | 100% |